
Why accessible spreadsheets matter
Accessible spreadsheets ensure everyone can access, understand, and use the information in your workbook, including people who use screen readers, keyboard navigation, screen magnification, speech recognition, and other assistive technology.
Unlike documents that are typically read from beginning to end, Excel workbooks are designed to sort, filter, search, calculate, and analyze data. People using assistive technology rely on workbook structure to understand how information is organized and how data is related. Well-structured worksheets and tables make workbooks easier to navigate and the data easier for everyone to interpret.
Determine whether Excel is the right format
Excel is designed to organize, calculate, analyze, and share structured data. Before creating a new workbook or remediating an existing one, consider whether Excel is the best format for the information you want to provide. In some cases, redesigning the content or choosing a different format is more effective than trying to remediate a complex workbook.
When Excel is appropriate
Use Excel when users need to:
- Work with structured data.
- Collect or update structured data in rows and columns.
- Sort, filter, or analyze information.
- Perform calculations.
- Export or reuse data.
- View structured data.
When another format may be better
Consider another format when:
- The content is primarily narrative text.
- The workbook functions primarily as a report rather than a dataset.
- Information is presented primarily through visual layouts or dashboards.
- Users need to complete and submit an interactive form.
When a CSV file may be appropriate
A CSV (comma-separated values) file contains data without Excel formatting or features. Consider using a CSV file when:
- Data will be published as a searchable table on Mass.gov.
- Users primarily need access to the raw data.
- Workbook formatting and Excel features are not required.
Keep in mind that CSV files do not preserve worksheet names, table formatting, formulas, images, alternative text, or document properties. Accessibility must be addressed wherever the data is published. If the CSV file is meant to be downloaded, there are no other accessibility steps required other than ensuring that the CSV is valid.
For Massachusetts state employees who publish content on Mass.gov, additional guidance for tables and CSV files is available in the Tables resource in the Knowledge Base.
Remediation vs. redesign
Many accessibility issues can be corrected without rebuilding an entire workbook. Examples include:
- Missing worksheet names.
- Missing document properties.
- Missing alternative text.
- Tables without clear column headers.
- Issues identified during accessibility testing.
Workbooks that use formulas, pivot tables, data validation, macros, or other advanced Excel features can often be made accessible. However, as workbook complexity increases, accessibility becomes more difficult to evaluate and maintain. In some cases, redesign may be a better long-term solution than remediation.
Consider redesigning a workbook when it contains:
- Multiple unrelated tables on one worksheet.
- Extensive merged cells.
- Dashboard- or form-style layouts.
- Multiple header rows or repeated section headers within tables.
- Complex visual formatting to organize information instead of table structure.
- Complex relationships between worksheets that make the workbook difficult to navigate or understand.
When possible, simplify the workbook or reorganize the information using a clearer structure or consider a different document type.
Use the Document Decision Tree to determine the best format for your content.
Create a logical workbook structure
A well-organized workbook is easier for everyone to navigate and understand, including people using assistive technology. Before formatting data, organize your workbook so each worksheet has a clear purpose and users can navigate through it in a logical order.
Use descriptive file and worksheet names
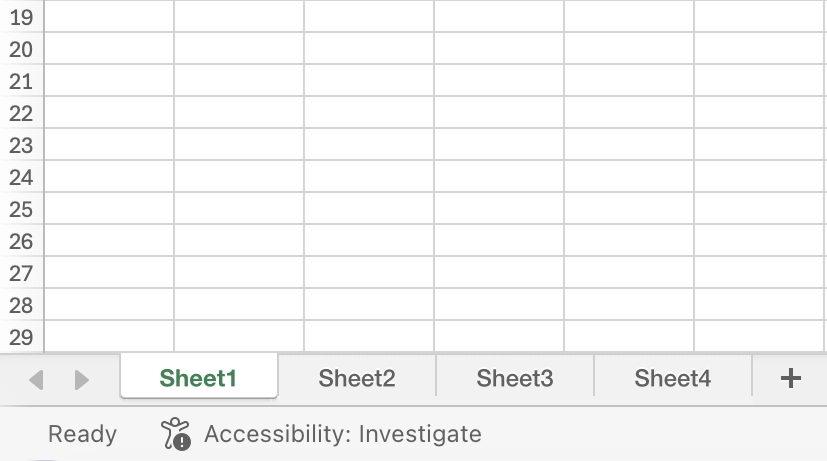
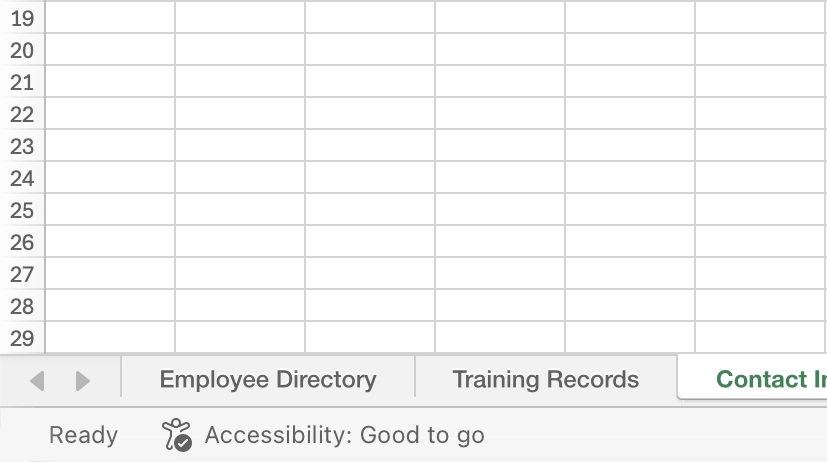
Choose a filename that clearly and concisely describes the workbook's contents. Replace default worksheet names, such as Sheet1 or Sheet2, with unique names that describe the information on each worksheet. To rename a worksheet, double-click the worksheet tab or right-click the tab and select Rename. Delete blank worksheets before sharing your workbook.
Add document properties
Document properties provide information about the workbook, including its title and language. Select File > Info > Properties to review and update the workbook's document properties. At a minimum, provide a descriptive title and verify that the correct language is set.
Start every worksheet with meaningful content
Cell A1 should never be blank.
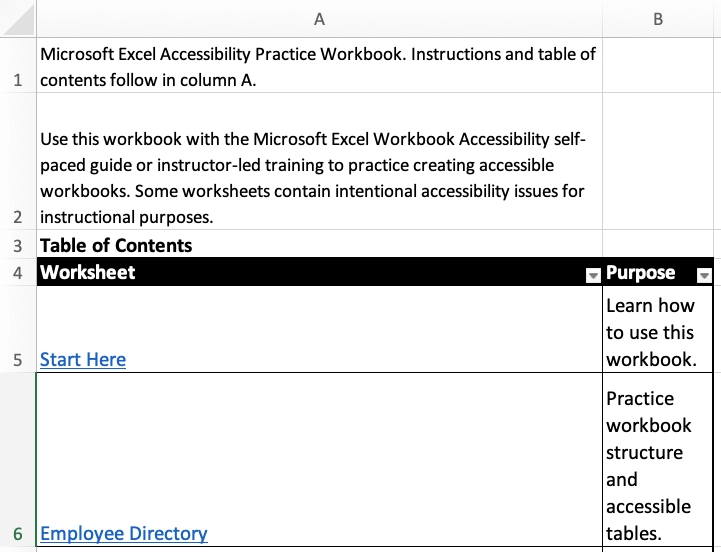
Use cell A1 to provide a worksheet title, a brief description, or instructions that help users understand the purpose of the worksheet before navigating the data. For complex worksheets, expand the information in cell A1 to include instructions or additional context before the table whenever possible.
Maintain a logical reading order
For English-language workbooks, organize content so users can navigate naturally from left to right and top to bottom. Whenever practical:
- Keep related information together.
- Use one primary table per worksheet.
- Avoid layouts that require users to jump around the worksheet to find related information.
Include an end-of-worksheet indicator
Add "End of worksheet" to the first empty cell outside of the formatted table immediately after the final data on each worksheet. This can help screen reader users recognize when they have reached the end of the worksheet.
Avoid placing essential information in headers, footers, or watermarks
Important information should appear within the worksheet, not just in page headers, footers, or watermarks. If essential information appears in one of these locations, repeat it in the worksheet so all users can access it.
Create accessible tables
Tables are the foundation of an accessible Excel workbook. They help organize data into rows and columns that assistive technology can understand and navigate. Well-structured tables also make workbooks easier for everyone to use.
Use Excel tables
Excel does not automatically recognize a range of cells as a table. Simply entering data into rows and columns or applying borders and shading does not create an Excel table. To create an accessible table, select your data and choose Insert > Table, or select an existing range of data and headers and choose Home > Format as Table. Excel tables provide the structure that assistive technology uses to identify column headers and navigate data.
Use a single header row
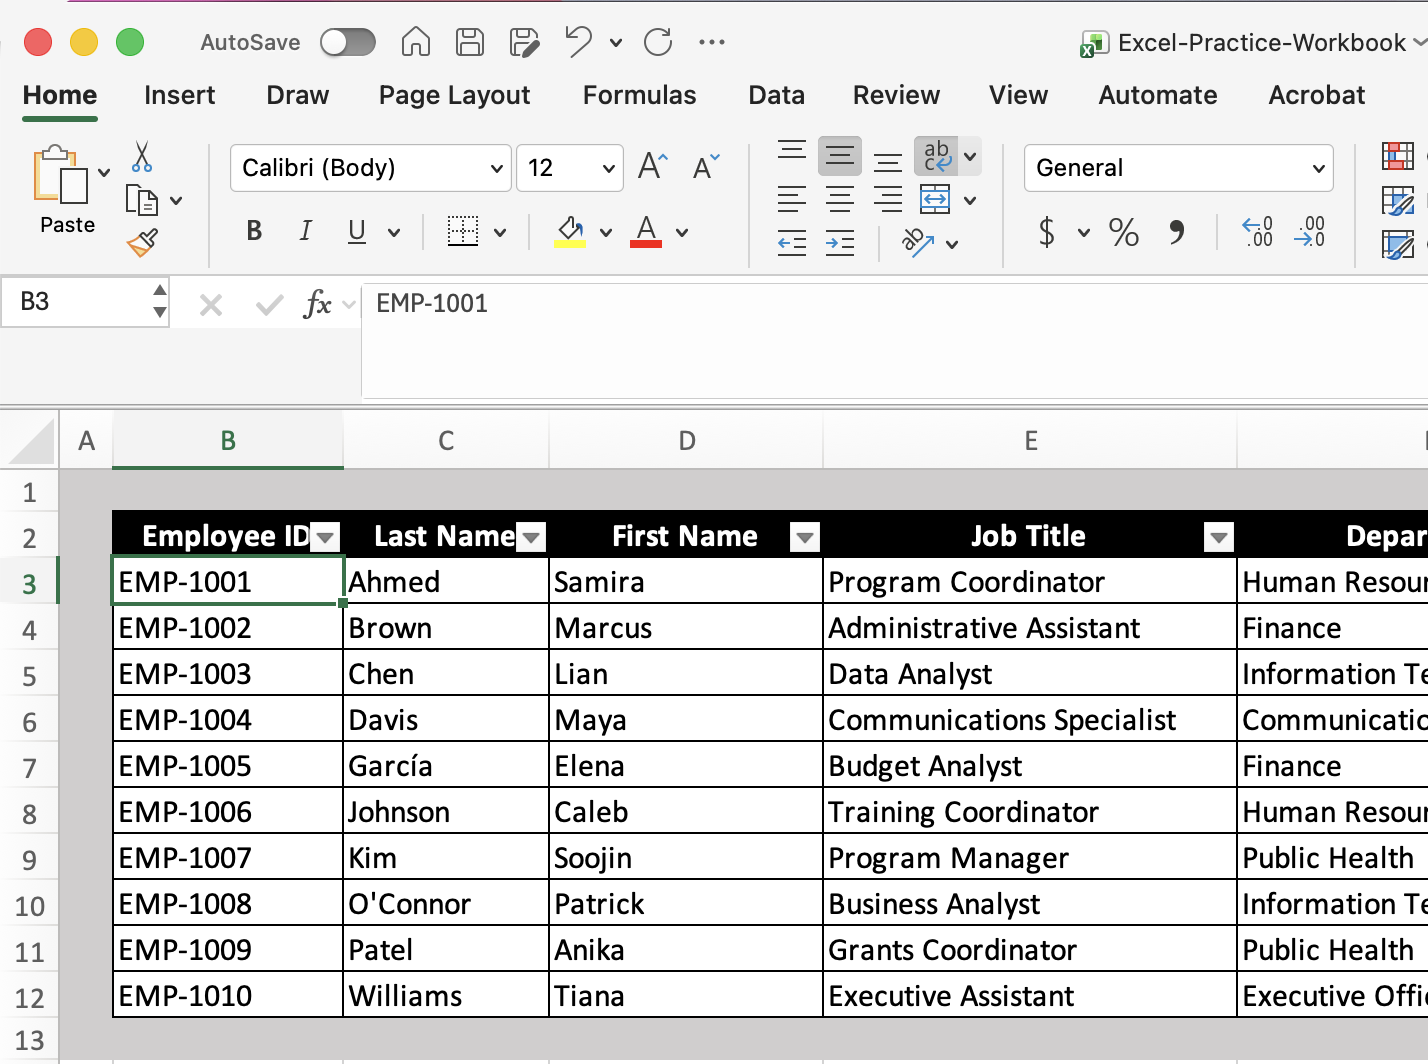
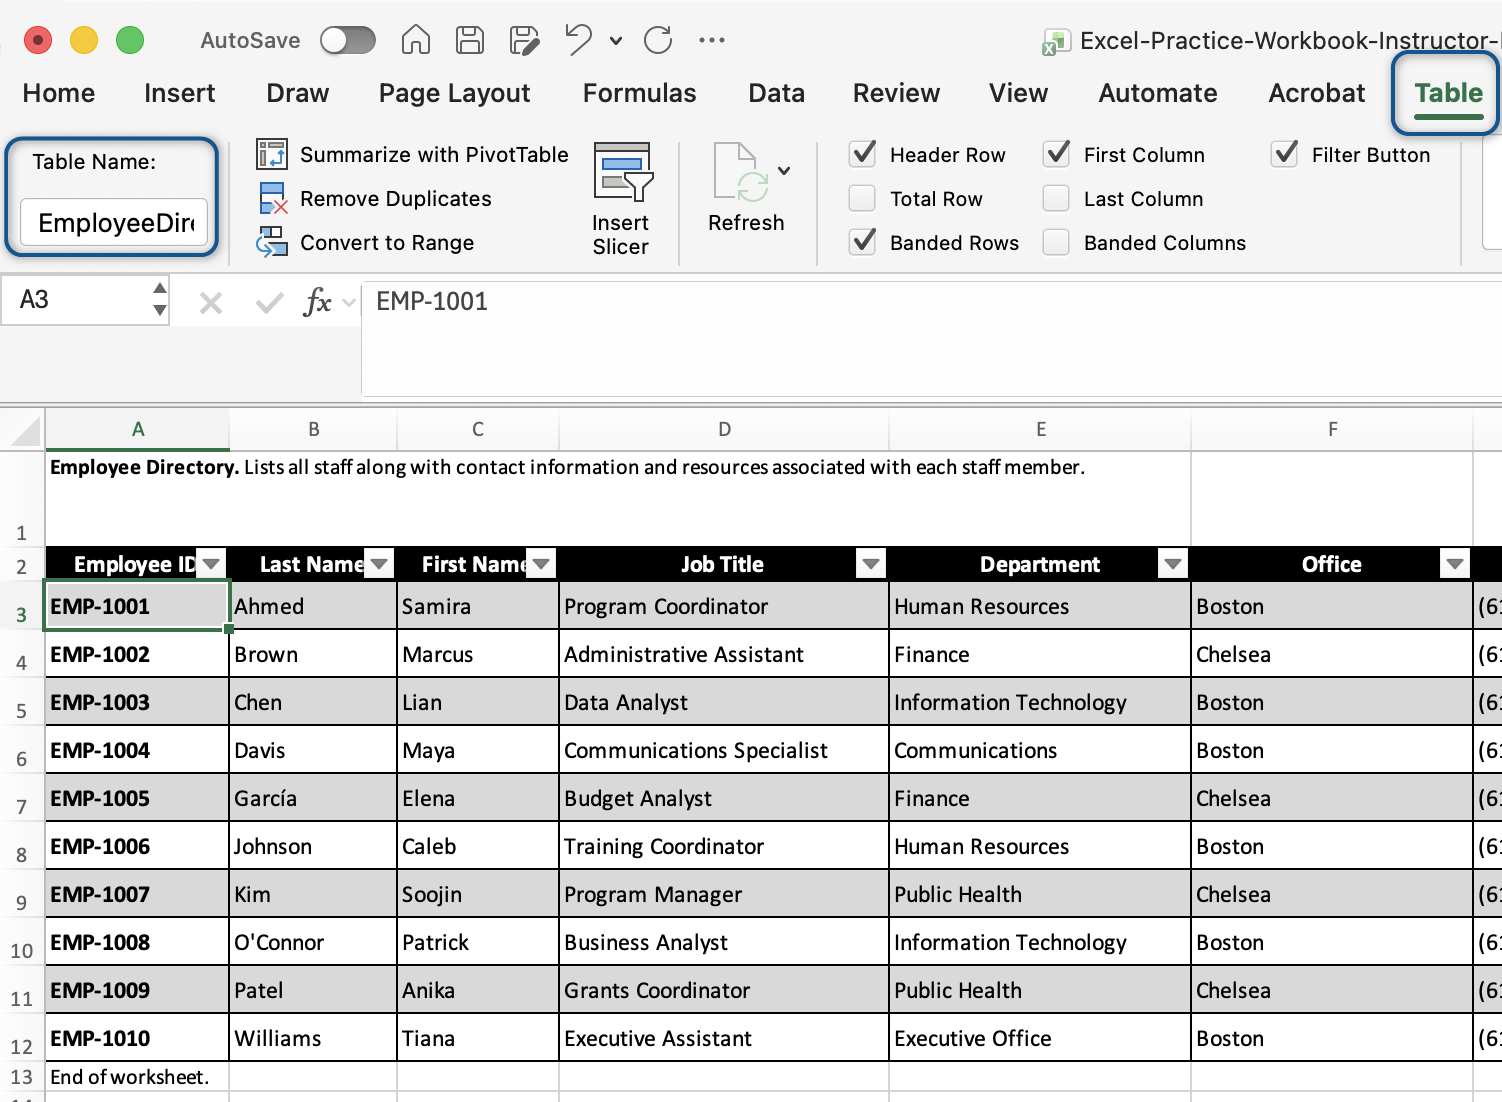
Each table should have one header row with clear, descriptive column headers. Some tables also use row headers in the first column to identify the data in each row. If your table includes row header cells, define them so assistive technology can correctly identify the relationship between row headers and data. Avoid multiple header rows, repeated section headers, or merged header cells within a table. These layouts can make it difficult for assistive technology to identify the relationship between headers and data.
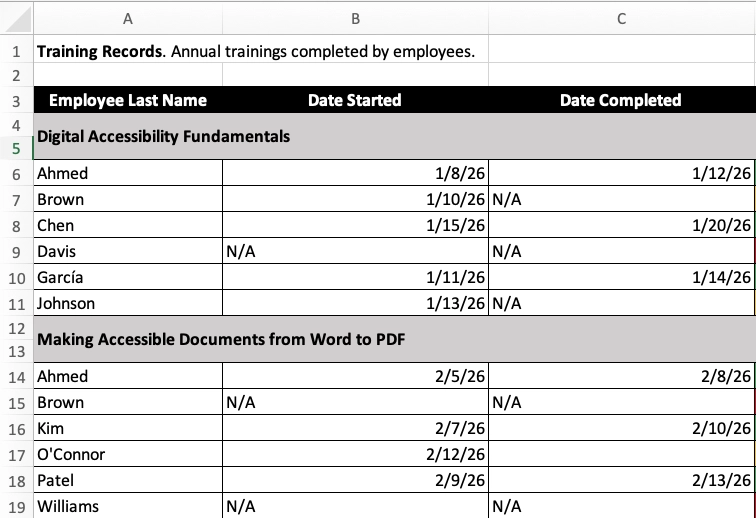
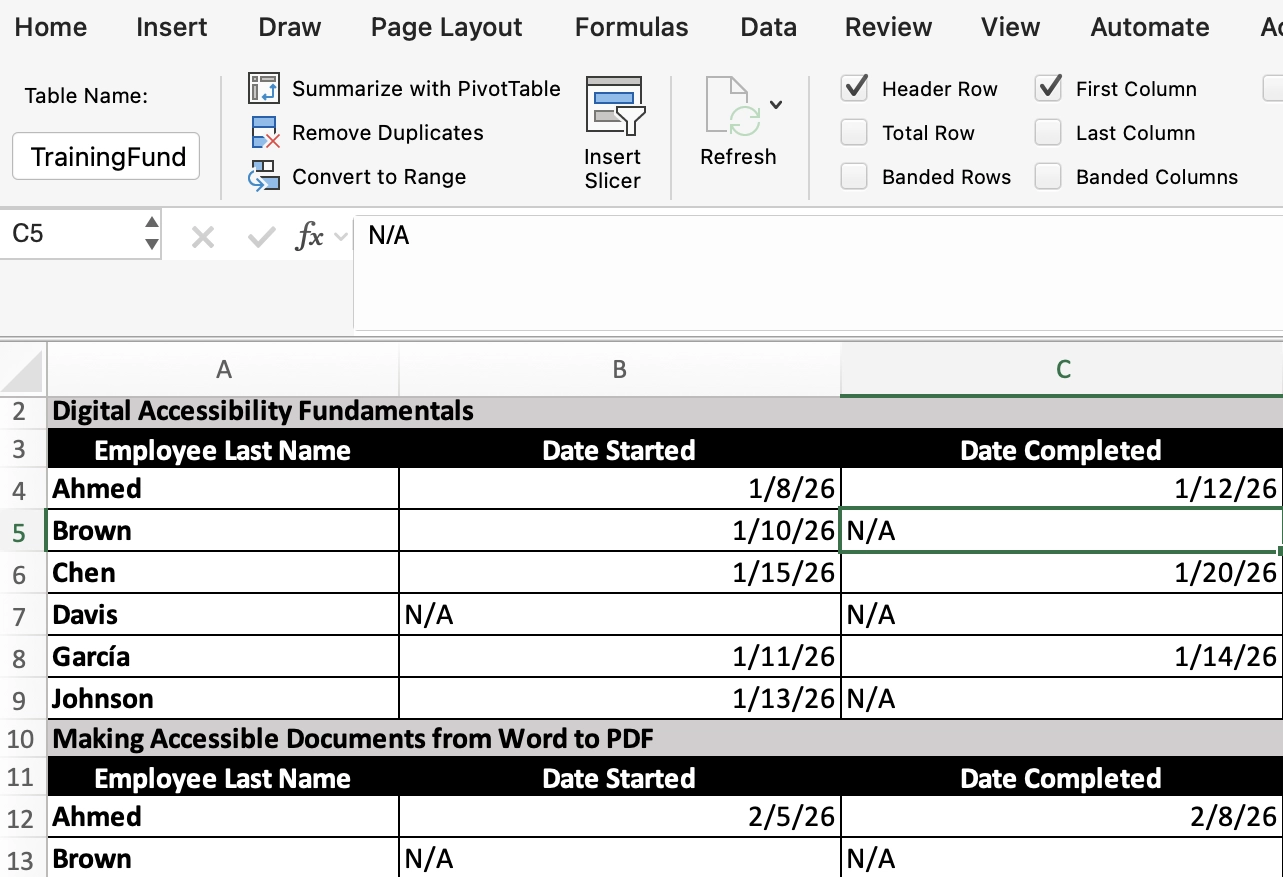
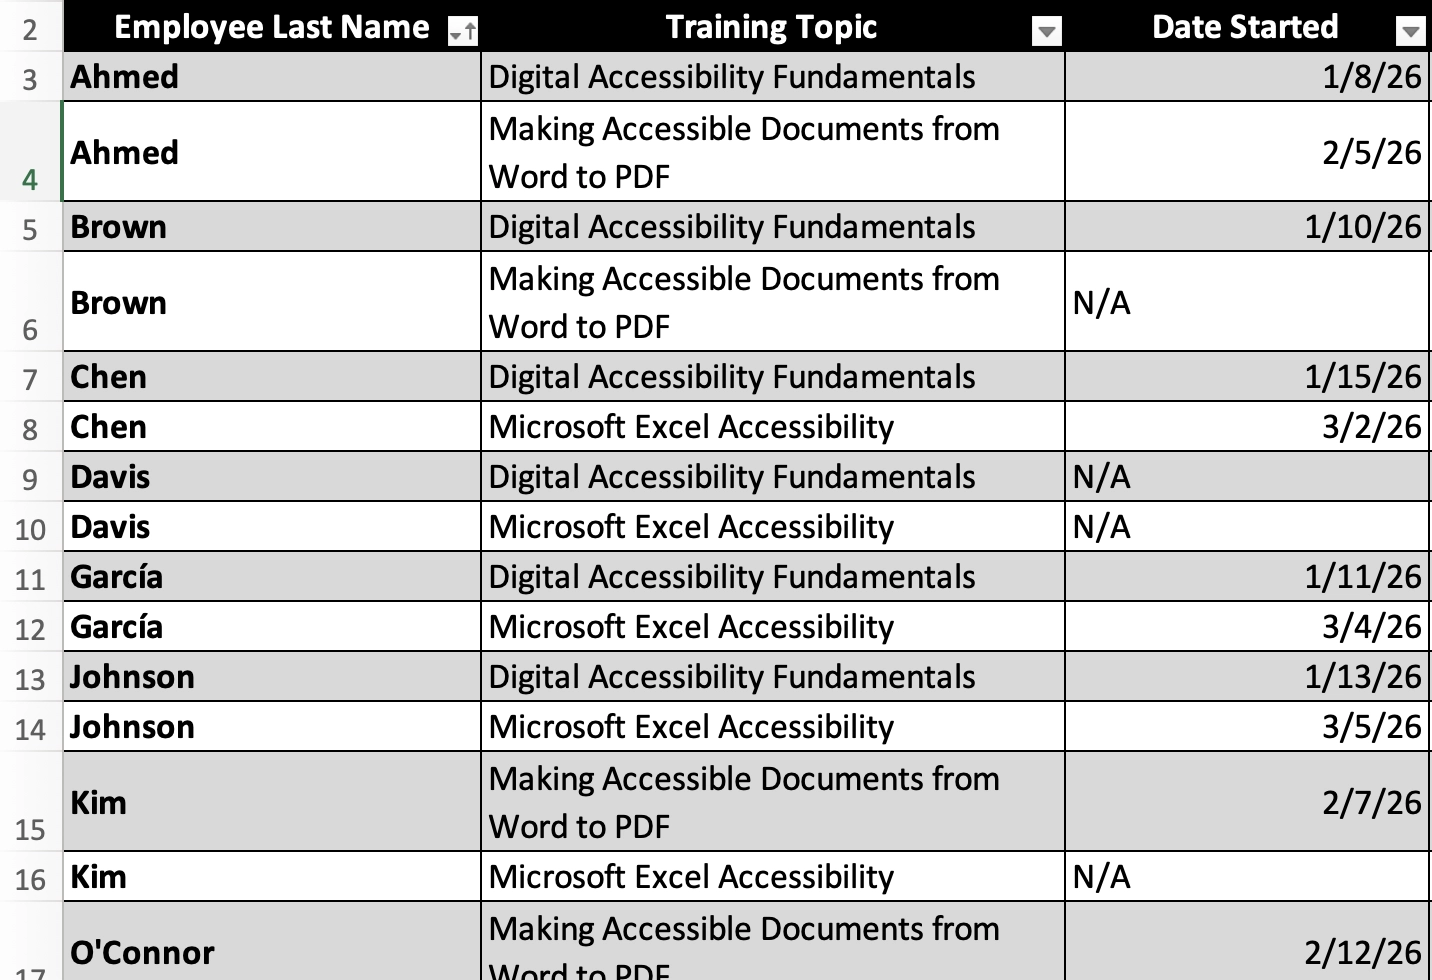
The strategy you use to eliminate multiple section headers depends on your data and the purpose of the table. In every table, use concise, meaningful column names and consistent terminology throughout the workbook.
Use descriptive table names
Excel automatically assigns names such as Table1 and Table2. Replace these with meaningful names that describe each table's purpose. Descriptive table names make workbooks easier to navigate and maintain. To rename a table, select any cell in the table, then use the Table Name box on the Table Design tab (or Table tab depending on version).
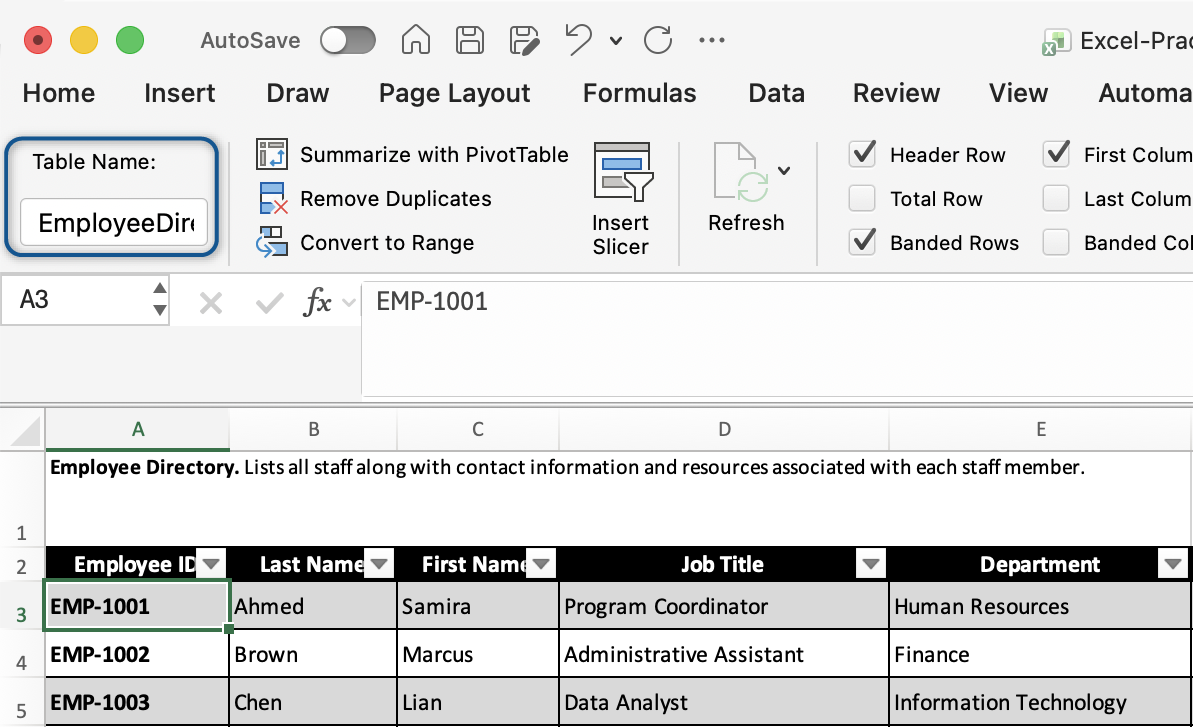
Tip: To navigate quickly to named tables and ranges, use Ctrl + G and select the item from the Go To dialog.
Keep tables simple
Whenever practical:
- Use one primary table per worksheet.
- Separate unrelated datasets into different worksheets.
- Use a simple row-and-column structure.
Simple tables are easier for everyone to understand, easier to maintain, and easier to remediate for accessibility.
Avoid merged cells
Avoid merged cells whenever possible. Merged cells interrupt the table structure that assistive technology use to identify rows and columns. If you need to align content, create visual spacing, or emphasize information, use text alignment, column widths, row heights, or cell styles.
Minimize blank rows and columns
Avoid blank rows and columns within a table. Screen readers may interpret a blank row or column as the end of the table. If a blank value is intentional, consider using text such as N/A, No Data, or Intentionally Blank, when appropriate.
Learn about handling blank data cells in accessible tables. (opens in new tab)
Add accessible content
Once your workbook is organized and your tables are in place, add content that is clear, meaningful, and accessible. Use visual formatting to improve readability, but do not rely on formatting alone to communicate information. Well-written text and accessible visuals help all users understand the information in your workbook.
Use meaningful cell content
Write clear, descriptive labels that help users understand the purpose of the information in each row and column. Whenever practical:
- Use plain language.
- Define abbreviations the first time they are used.
- Include units of measure in column headers when appropriate.
- Use consistent formats for dates, numbers, and currency.
- Add properly formatted hyperlinks rather than URLs whenever possible.
For more information about plain language, visit Putting plain language into practice in government.
Identify row headers and name important ranges
Properly formatted Excel tables identify column headers automatically. If the first column contains row headers, enable the First Column option on the Table Design tab. This helps distinguish row headers from the rest of the data and supports navigation in Excel. You can also assign descriptive names to important cells or ranges. Named ranges make it easier to navigate large or complex workbooks by providing descriptive names for important areas of the workbook.
To identify row headers:
- Select any cell in the table.
- Select the Table Design tab.
- In Table Style Options, select First Column.
To name a cell or range:
- Select the cell or range.
- Select Formulas > Define Name.
- Enter a short, descriptive name with no spaces or punctuation (for example, EmployeeData or QuarterlyTotals).
- Select OK.
Hidden worksheets, rows, and columns
Hidden worksheets, rows, and columns can be overlooked during accessibility evaluation. Before sharing your workbook:
- Remove hidden content that is no longer needed.
- Do not hide essential information that people need to access.
- Review hidden content as part of your accessibility evaluation.
If hidden worksheets, rows, or columns remain in the workbook, include them in your accessibility evaluation.
Add alt text to meaningful visuals
Provide alternative text for meaningful content, such as:
- Images
- Charts
- SmartArt
- Shapes
- Other visuals
Mark decorative visuals as decorative. Avoid using images of text when the same information can be presented as worksheet content. Typically, the only acceptable time to use images of text is for logos with accurate alt text.
Tip: Most visuals, including charts, are floating objects in Excel rather than content in cells. To move focus to charts and other floating objects using your keyboard, use Ctrl + Alt + 5. Use the Tab key to move between objects and Esc to return to the worksheet content.
Make charts accessible
Use descriptive chart titles, meaningful axis labels, and data labels when they help users interpret the information. For charts that communicate complex information, include a brief summary or explanation before users encounter the chart whenever possible. For more information about accessible charts and graphs, visit the Data visualization accessibility resource.
Accessibility considerations for advanced Excel features
Excel supports many advanced features that help users analyze data, automate tasks, and collect information. These features are not inherently inaccessible. However, as workbook complexity increases, accessibility becomes more difficult to evaluate and maintain. Whenever possible, organize information using a clear, logical structure and avoid unnecessary complexity.
| Feature | Accessibility Considerations |
|---|---|
| Data validation and dropdown lists | Provide clear, visible instructions, input messages, and customized error messages when using data validation. Do not rely on color alone to indicate required or invalid entries. |
| Pivot tables | Verify that headers remain understandable and the relationships between data are clear after the pivot table is created or updated. |
| Slicers and filters | Verify that users can access and operate them using only the keyboard and that instructions are provided when needed. |
| Workbook protection | Make sure workbook or worksheet protection does not prevent keyboard navigation or accessibility evaluation. |
| Macros and automation | Ensure essential information and functionality are available to all users. Complex macro-driven workbooks may require additional accessibility evaluation. |
Interactive features
Features such as comments, notes, dropdown lists, and data validation can provide additional information or guide data entry. When using these features:
- Provide clear, visible instructions within the worksheet.
- Do not place essential information only in comments or notes.
- Ensure users can understand how to complete the task without relying on color alone.
Complex workbook relationships
Large workbooks often contain multiple worksheets, formulas, linked calculations, or other relationships between data. When creating or remediating complex workbooks:
- Organize worksheets in a logical order.
- Use descriptive worksheet and table names.
- Keep each table organized with a single header row.
- Avoid creating multiple unrelated tables on the same worksheet.
Data collection and forms
Excel can be an effective tool for collecting structured data only when information is entered into a properly formatted table with meaningful headers and clear instructions.
Evaluate workbook accessibility
Before sharing your workbook, evaluate its accessibility using the Microsoft Excel accessibility testing checklist. The checklist combines automated testing with manual review to identify common accessibility issues and help make your workbook as accessible as possible.
Use the Microsoft Accessibility Assistant
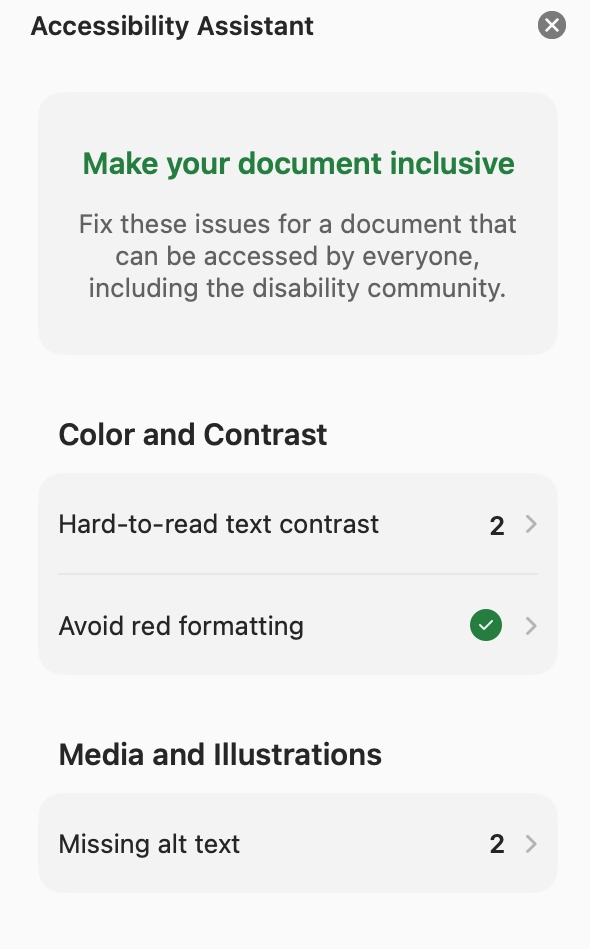
The first step in the checklist is to run the Microsoft Accessibility Assistant.
- Select Review > Check Accessibility.
- Review each issue identified by the Accessibility Assistant and follow Microsoft's recommendations to correct identified issues before continuing your evaluation.
The Accessibility Assistant identifies many common accessibility issues, but it does not evaluate every aspect of workbook accessibility. For example, it cannot determine whether complex workbook relationships, formulas, macros, pivot tables, slicers, or interactive features remain accessible.
Complete the remaining checklist items
Many checklist items require you to review the workbook manually. As you work through the checklist, verify that:
- Worksheets are organized logically.
- Tables are formatted as Excel tables.
- Worksheet names, table names, and document properties are descriptive.
- Alternative text accurately describes meaningful visuals.
- Hyperlinks are descriptive.
- Color is not the only way information is conveyed.
- Plain language principles have been applied.
The earlier sections of this guide explain many of the workbook-specific checks included in the checklist. For more information about plain language, hyperlinks, color contrast, alternative text, and other digital accessibility topics, refer to the related Accessibility fundamentals training resources.
Review keyboard navigation
Move through the workbook using only the keyboard such as the Tab key for interactive elements or the arrow keys for moving between cells. To move focus to charts and other floating objects using your keyboard, use Ctrl + Alt + 5. Use the Tab key to move between objects and Esc to return to the worksheet content. Confirm that you can:
- Navigate worksheets in a logical order.
- Move through tables without unexpected interruptions.
- Reach interactive features without using a mouse.
Keyboard navigation helps identify issues that may not be detected by the Accessibility Assistant.
When workbook complexity increases
Some Excel workbooks are more complex than others. Workbooks that contain multiple worksheets, pivot tables, slicers, macros, complex formulas, dashboard- or form-style layouts, or extensive use of data validation often require more careful accessibility evaluation. These features are not inherently inaccessible. However, as workbook complexity increases, accessibility becomes more difficult to evaluate and maintain. If you're evaluating a complex workbook:
- Complete the Microsoft Excel accessibility testing checklist.
- Correct accessibility issues that can be remediated.
- Consider whether simplifying or reorganizing the workbook would improve accessibility.
- Determine whether remediation is practical or whether redesign is the better long-term solution.
If you're unsure how to proceed, additional accessibility guidance may help you determine whether a workbook can be effectively remediated or should be redesigned. If you are an employee of a the Commonwealth, or a Massachusetts municipality or public school, sign up to visit us in Accessibility Office Hours.
Final review before sharing
Before sharing your workbook, confirm that you have completed the Microsoft Excel accessibility testing checklist and addressed the issues identified during your review.
Remember that accessibility is determined by the overall usability of the workbook — not by a single tool or test.